Python 에서 chart, plot 을 그리는 도구로 널리 알려진 것들 중에는 matplotlib, seaborn, plotly, ggplot 등이 있습니다. 그 중에서 Bokeh 는 Python 혹은 Jupyter notebook 환경에서 d3 만큼이나 멋진 plot 을 그릴 수 있도록 도와줍니다. Bokeh 의 documentation 과 tutorials 은 설명이 매우 친절합니다. 하지만 quick starting 보다 더 quick 하게 이용하고 싶어, 자주 쓰는 기능과 설명을 정리하였습니다. 이 포스트에는 각 라이브러리의 비교가 포함되어있지 않습니다.
Bokeh?
이 포스트에는 Bokeh 공식 홈페이지의 튜토리얼 코드가 포함되어 있습니다. 튜토리얼 코드를 따라 연습하며, 기억하고 싶은 내용에 대한 커멘트를 추가하였습니다. 자세한 Bokeh 의 공부를 위해서는 공식 홈페이지로 곧바로 가보세요! 이런 친절한 튜토리얼 코드를 제공해주는 모든 개발자분들 감사합니다!
This post includes the tutorial codes on the official homepage. I just putted additional comment in the tutorial codes. For detailed tutorials, please visit the official website. Thanks to Bokeh’s friendly tutorial.
Python 으로 작업을 한 뒤, plotting 을 할 일이 있으면 습관적으로 matplotlib 을 이용하였습니다. Matplotlib 도 좋은 라이브러리이지만, attribute 세팅이나 사용법에서 불편함을 느낀 적이 많았습니다. 그 대안으로 다른 시각화 방법들을 찾던 중, Bokeh 를 써보라는 추천을 받았습니다. 그리고는 바로 포스트를 쓰게 되었습니다. “Seaborn 같은 라이브러리가 좋다더라~” 라는 말을 듣고도 한번도 써보지 않던 옛날의 저를 반성였습니다. 앞으로는 좋은 라이브러리들을 부지런하게 살펴봐야겠다는 생각을 하며, 저의 quick starting 과정을 정리하였습니다.
Bokeh 는 d3 와 비슷한 멋진 plots 을 그릴 수 있도록 도와줍니다. 일단 그림이 예쁩니다. 하지만 d3 를 이용하지는 않습니다. Technical vision 을 읽어보면, stand alone library 라고 적혀있습니다. 또한 interactive 한 plotting 이 가능합니다. 그렇기 때문에 설명력이 많은 plotting 을 그릴 수 있습니다. gallery 가 잘 만들어져서 필요한 plot 의 코드를 그대로 가져오면 됩니다. jupyter notebook 튜토리얼도 함께 제공됩니다.
포스트 당시 Bokeh 는 version = 0.12.15 입니다.
Install
Pip install 이 가능합니다.
pip install bokeh공식홈페이지에서는 최소한 다음의 required dependencies 를 언급합니다. 만약 anaconda 의 모든 페키지를 다 설치하셨다면 pip install bokeh 만 하셔도 됩니다.
Jinja2 >=2.7
python-dateutil >=2.1
PyYAML >=3.10
numpy >=1.7.1
packaging >=16.8
six >=1.5.2
tornado >=4.3
하지만 io 를 위해서는 추가적인 packages 가 필요합니다. Bokeh 는 JavaScript 를 이용하여 그린 plot 을 png 파일로 저장하기 위해, Selenium 을 이용합니다. Python 환경에서 가상으로 웹페이지를 띄운 뒤, 그림을 파일로 저장합니다. 이를 위해서는 다음의 설치가 필요합니다.
pip install selenium
pip install phantomjs
pip intsall pillow
저는 Ubuntu 에서 phantomjs 가 pip install 로 설치되지 않았습니다. 다음처럼 apt-get 을 이용하여 설치하였습니다.
suto apt-get install phantomjs
First plot
Figure 는 그림을 그리기 위한 ‘판’ 입니다.
Bokeh 의 plot 을 표현하는 방법은 html 파일로 내보내는 것과 Jupyter notebook 의 결과로 보여주는 것이 있습니다. output_file 은 figure 를 입력된 html 파일로 저장합니다. output_notebook() 을 입력하면 notebook 에 출력됩니다.
모든 그림을 그리고 나면 show() 안에 figure 를 입력합니다.
from bokeh.plotting import figure, output_file, output_notebook, show

x = [1, 2, 3, 5, 7]
y = [5, 1, 2, 7, 10]

# output to static HTML file
output_file("lines.html")

# output to notebook
output_notebook()

# create a new plot with a title and axis labels
p = figure(title="Title",
           x_axis_label='x',
           y_axis_label='y')

# add a line renderer with legend and line thickness
p.line(x, y, legend="variance", line_width=2)

# show the results
show(p)
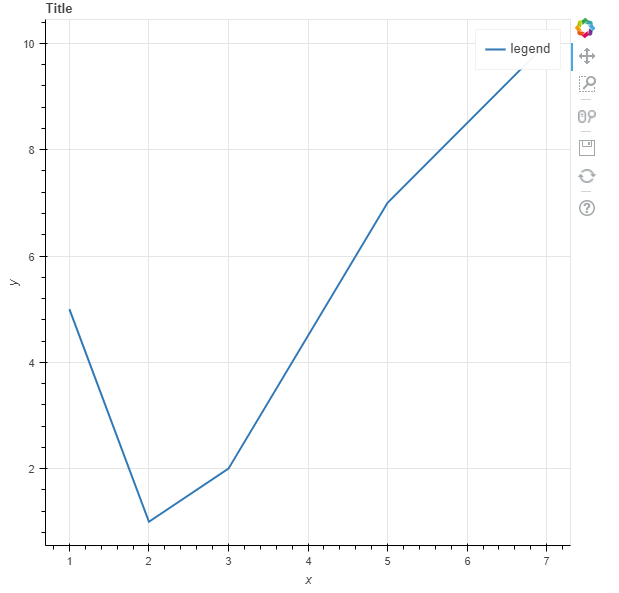
그 결과는 아래와 같습니다. 아래 그림은 plot 과 options 이 함께 포함되어 있습니다. 우측 상단의 options 에는 Box zoom, reset 같은 기능들이 있습니다. 디스크 모양 아이콘은 save 입니다. 만약 zoom-in 을 한 상태에서 save 를 하면 zoom-in 상태 그대로 저장이 됩니다. 이런 점이 matplotlib 보다 훨씬 편리한 점이라 생각됩니다.

Figure size
그림의 사이즈를 조절할 수 있습니다. bokeh.plotting.figure 를 만들 때 plot_width, plot_height 를 입력할 수 있습니다.
from bokeh.plotting import figure

# create a new plot with plot size options
p = figure(title="Title",
           x_axis_label='x',
           y_axis_label='y',
           plot_width=500,
           plot_height=200)
혹은 만들어진 그림의 plot_width, plot_height 를 조절할 수도 있습니다. JavaScript 객체의 attribute 를 변경하는 것과 같습니다.
p.plot_width = 800
p.plot_height = 800
하지만 다시 한 번 show() 를 하여야 그림이 출력됩니다.
또한 jupyter notebook 에서 두 번의 show() 를 호출하였다면 두 개의 그림이 그려집니다.
Changing title
Bokeh 의 title 은 str 이 아닙니다. plot_width, plot_height 처럼 파이썬 기본형의 attribute 가 아니기 때문에 다음처럼 attribute 를 수정합니다.
# change size and re-show
p.title.text = 'Resized Bokeh Markers'
p.title.text_color = "olive"
p.title.text_font = "times"
p.title.text_font_style = "italic"

p.plot_width = 500
p.plot_height = 500
Title 외의 style 에 관련된 documentation 은 style guide에 있습니다.
Save figures
Bokeh 는 figure 를 svg 와 png 로 저장합니다. 둘 모두 bokeh.io 에서 import 합니다.
from bokeh.io import export_png, export_svgs

export_png(p, filename='bokeh_network_sample.png')
export_svgs(p, filename='bokeh_network_sample.svg')
Bokeh 는 그림을 저장할 때 selenium 으로 가상의 웹페이지를 띄운 뒤, 이를 저장합니다. 그래서 selenium, phantomjs, pillow 가 없으면 작동하지 않습니다. 또한 selenium 을 한 번 띄우기 때문에 하나의 그림을 저장하는데 시간이 걸립니다.
Heatmap
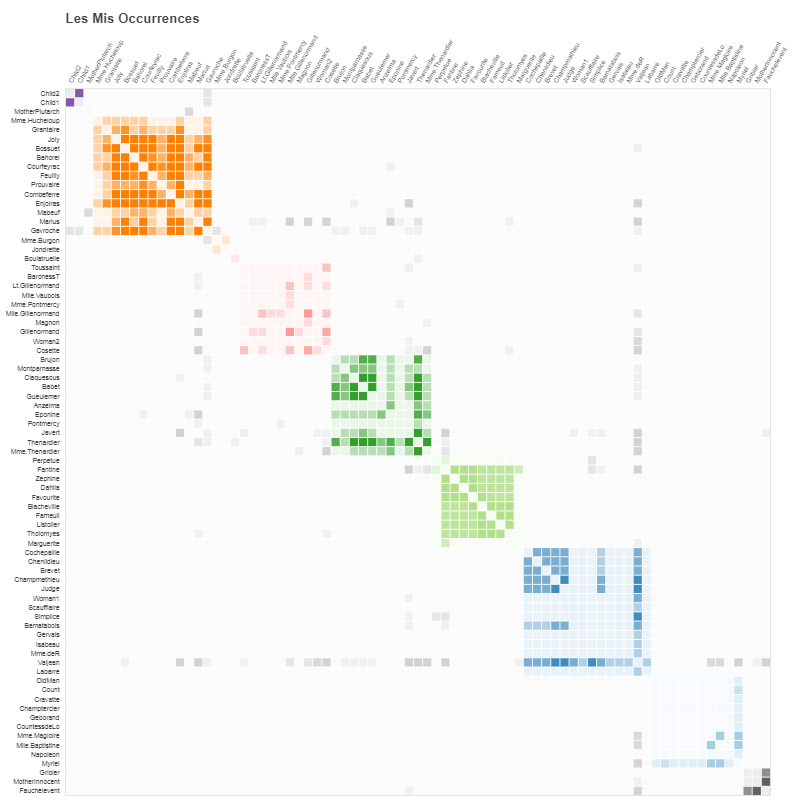
Bokeh 의 샘플데이터를 이용한 heat map 튜토리얼입니다.
import numpy as np

from bokeh.plotting import figure, show, output_file
from bokeh.models import HoverTool, ColumnDataSource
from bokeh.sampledata.les_mis import data
사용하는 data 는 nodes, links 로 구성되어 있습니다.
print(data.keys())
# dict_keys(['nodes', 'links'])
nodes 는 각 노드가 속한 그룹과 name 으로 구성되어 있습니다.
print(data['nodes'][:5])
# [{'group': 1, 'name': 'Myriel'},
#  {'group': 1, 'name': 'Napoleon'},
#  {'group': 1, 'name': 'Mlle.Baptistine'},
#  {'group': 1, 'name': 'Mme.Magloire'},
#  {'group': 1, 'name': 'CountessdeLo'}]
links 는 노드 간의 연결 관계가 value 로 들어있습니다.
print(data['links'][:5])
# [{'source': 1, 'target': 0, 'value': 1},
#  {'source': 2, 'target': 0, 'value': 8},
#  {'source': 3, 'target': 0, 'value': 10},
#  {'source': 3, 'target': 2, 'value': 6},
#  {'source': 4, 'target': 0, 'value': 1}]
links 의 value 를 matrix 로 변환합니다.
N = len(nodes)
counts = np.zeros((N, N))
for link in data['links']:
    counts[link['source'], link['target']] = link['value']
    counts[link['target'], link['source']] = link['value']
아래와 같은 numpy.ndarray 형식입니다.
# counts[:10, :10]
array([[  0.,   1.,   8.,  10.,   1.,   1.,   1.,   1.,   2.,   1.],
   [  1.,   0.,   0.,   0.,   0.,   0.,   0.,   0.,   0.,   0.],
   [  8.,   0.,   0.,   6.,   0.,   0.,   0.,   0.,   0.,   0.],
   [ 10.,   0.,   6.,   0.,   0.,   0.,   0.,   0.,   0.,   0.],
   [  1.,   0.,   0.,   0.,   0.,   0.,   0.,   0.,   0.,   0.],
   [  1.,   0.,   0.,   0.,   0.,   0.,   0.,   0.,   0.,   0.],
   [  1.,   0.,   0.,   0.,   0.,   0.,   0.,   0.,   0.,   0.],
   [  1.,   0.,   0.,   0.,   0.,   0.,   0.,   0.,   0.,   0.],
   [  2.,   0.,   0.,   0.,   0.,   0.,   0.,   0.,   0.,   0.],
   [  1.,   0.,   0.,   0.,   0.,   0.,   0.,   0.,   0.,   0.]])
그 아래는 tutorials 의 코드입니다. 위의 numpy.ndarray 에 대한 heatmap plotting 입니다.
여기서 HoverTool 은 bokeh.plotting.figure.rect 로 그려진 그림의 위에 커서를 올리면 각 아이템의 (select one) 성질을 표현합니다. 만약 p.select_one(HoverTool) 을 설정하지 않으면 canvas 의 좌표가 출력됩니다. 아래의 코드에서는 (‘names’, ‘count’) 를 출력하게 하였기 때문에 node 의 name 이 출력됩니다.
nodes = data['nodes']
names = [node['name'] for node in sorted(data['nodes'], key=lambda x: x['group'])]

# same length with groups
colormap = ["#444444", "#a6cee3", "#1f78b4", "#b2df8a", "#33a02c", "#fb9a99",
            "#e31a1c", "#fdbf6f", "#ff7f00", "#cab2d6", "#6a3d9a"]

xname = []
yname = []
color = []
alpha = []
for i, node1 in enumerate(nodes):
    for j, node2 in enumerate(nodes):
        xname.append(node1['name'])
        yname.append(node2['name'])

        alpha.append(min(counts[i,j]/4.0, 0.9) + 0.1)

        if node1['group'] == node2['group']:
            color.append(colormap[node1['group']])
        else:
            color.append('lightgrey')

source = ColumnDataSource(data=dict(
    xname=xname,
    yname=yname,
    colors=color,
    alphas=alpha,
    count=counts.flatten(),
))

p = figure(title="Les Mis Occurrences",
           x_axis_location="above", tools="hover,save",
           x_range=list(reversed(names)), y_range=names)

p.plot_width = 800
p.plot_height = 800
p.grid.grid_line_color = None
p.axis.axis_line_color = None
p.axis.major_tick_line_color = None
p.axis.major_label_text_font_size = "5pt"
p.axis.major_label_standoff = 0
p.xaxis.major_label_orientation = np.pi/3

p.rect('xname', 'yname', 0.9, 0.9, source=source,
       color='colors', alpha='alphas', line_color=None,
       hover_line_color='black', hover_color='colors')

p.select_one(HoverTool).tooltips = [
    ('names', '@yname, @xname'),
    ('count', '@count'),
]

output_notebook()

show(p) # show the plot
Overlap figures (with loop)
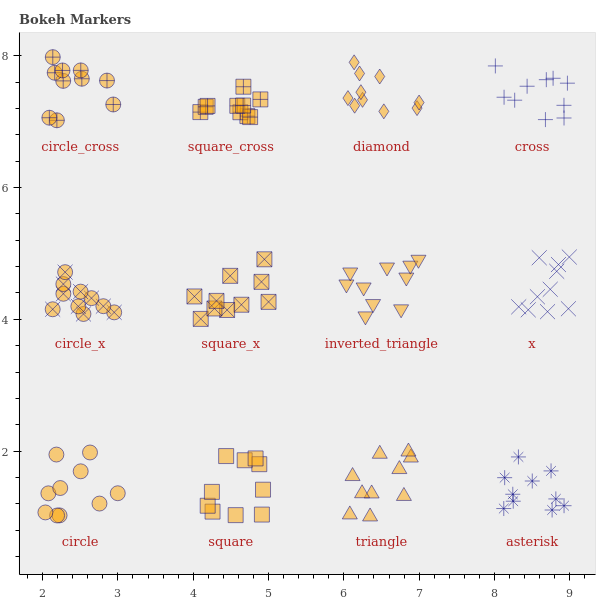
아래는 Bokeh 의 scatter plot 의 튜토리얼을 변형한 코드입니다. mscatter() 는 figure, x, y, marker 를 입력받아 scatter plot 을 그립니다. show() 를 하지 않았기 때문에 그 위에 중첩하여 그림을 그릴 수 있습니다.
x, y 의 center 를 옮겨가며, center 주변에 조금씩 흐트려트린 좌표에 각각의 marker 를 그렸습니다.
그림 위에 annotation 을 하고 싶을 때에는 figure.text() 를 이용합니다.
from numpy.random import random

from bokeh.plotting import figure, show, output_notebook

def mscatter(p, x, y, marker):
    p.scatter(x, y, marker=marker, size=15,
              line_color="navy", fill_color="orange", alpha=0.5)

def mtext(p, x, y, text):
    p.text(x, y, text=[text],
           text_color="firebrick", text_align="center", text_font_size="10pt")

p = figure(title="Bokeh Markers", toolbar_location=None)
p.grid.grid_line_color = None
p.background_fill_color = "#eeeeee"

x_centers = [2, 4, 6, 8]
y_centers = [1, 4, 7]

x_text_shift = 0.5
y_text_shift = -0.5

markers = [['circle', 'square', 'triangle', 'asterisk'],
           ['circle_x', 'square_x', 'inverted_triangle', 'x'],
           ['circle_cross', 'square_cross', 'diamond', 'cross']]

N = 10

for y_idx, y_center in enumerate(y_centers):
    for x_idx, x_center in enumerate(x_centers):

        mscatter(p = p,
                 x = random(N) + x_center,
                 y = random(N) + y_center,
                 marker = markers[y_idx][x_idx]
                )

        mtext(p = p,
              x = x_center + x_text_shift,
              y = y_center + y_text_shift,
              text = markers[y_idx][x_idx]
             )

output_notebook()
show(p)
Multiple plot (Gridplot)
아래는 multiline 을 plotting 하는 튜토리얼 코드입니다. figure 에는 여러 개의 그림을 겹칠 수 있습니다. 여러 layers 를 쌓는 느낌입니다. 만약 여러 개의 plot 을 모아서 plotting 을 하려면 bokeh.layouts.gridplot 을 이용합니다.
import numpy as np

from bokeh.layouts import gridplot
from bokeh.plotting import figure, show, output_file

x = np.linspace(0, 4*np.pi, 100)
y = np.sin(x)

TOOLS = "pan,wheel_zoom,box_zoom,reset,save,box_select"

p1 = figure(title="Legend Example", tools=TOOLS)

p1.circle(x,   y, legend="sin(x)")
p1.circle(x, 2*y, legend="2*sin(x)", color="orange")
p1.circle(x, 3*y, legend="3*sin(x)", color="green")

p2 = figure(title="Another Legend Example", tools=TOOLS)

p2.circle(x, y, legend="sin(x)")
p2.line(x, y, legend="sin(x)")

p2.line(x, 2*y, legend="2*sin(x)", line_dash=(4, 4), line_color="orange", line_width=2)

p2.square(x, 3*y, legend="3*sin(x)", fill_color=None, line_color="green")
p2.line(x, 3*y, legend="3*sin(x)", line_color="green")

#output_file("legend.html", title="legend.py example")

# create gridplot
gp = gridplot(p1, p2, ncols=2, plot_width=400, plot_height=200)

show(gp)
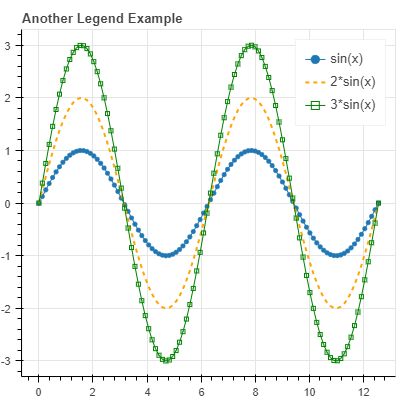
gridplot 은 p1, p2 를 묶어서 하나의 grid 를 만듭니다. ncols = 2 이기 때문에 two column 이 그려집니다.
plot_width, plot_height 는 각 plot 의 width, height 입니다.
gp = gridplot(p1, p2, ncols=2, plot_width=400, plot_height=200)Jupyter notebook 에서 출력된 그림의 save 아이콘을 누르면 가장 마지막에 그려진 “Another Legend Example” 만 저장됩니다. 만약 둘 모두를 저장하고 싶다면 gridplot 을 gp 로 받은 뒤, 이를 explort_png() 에 입력하면 됩니다.

export_png(gp, 'gridplot.png')
ncols 를 입력하지 않고, 직접 plots 을 넣을 수도 있습니다.
gridplot([[plot_1, plot_2], [plot_3, plot_4]])